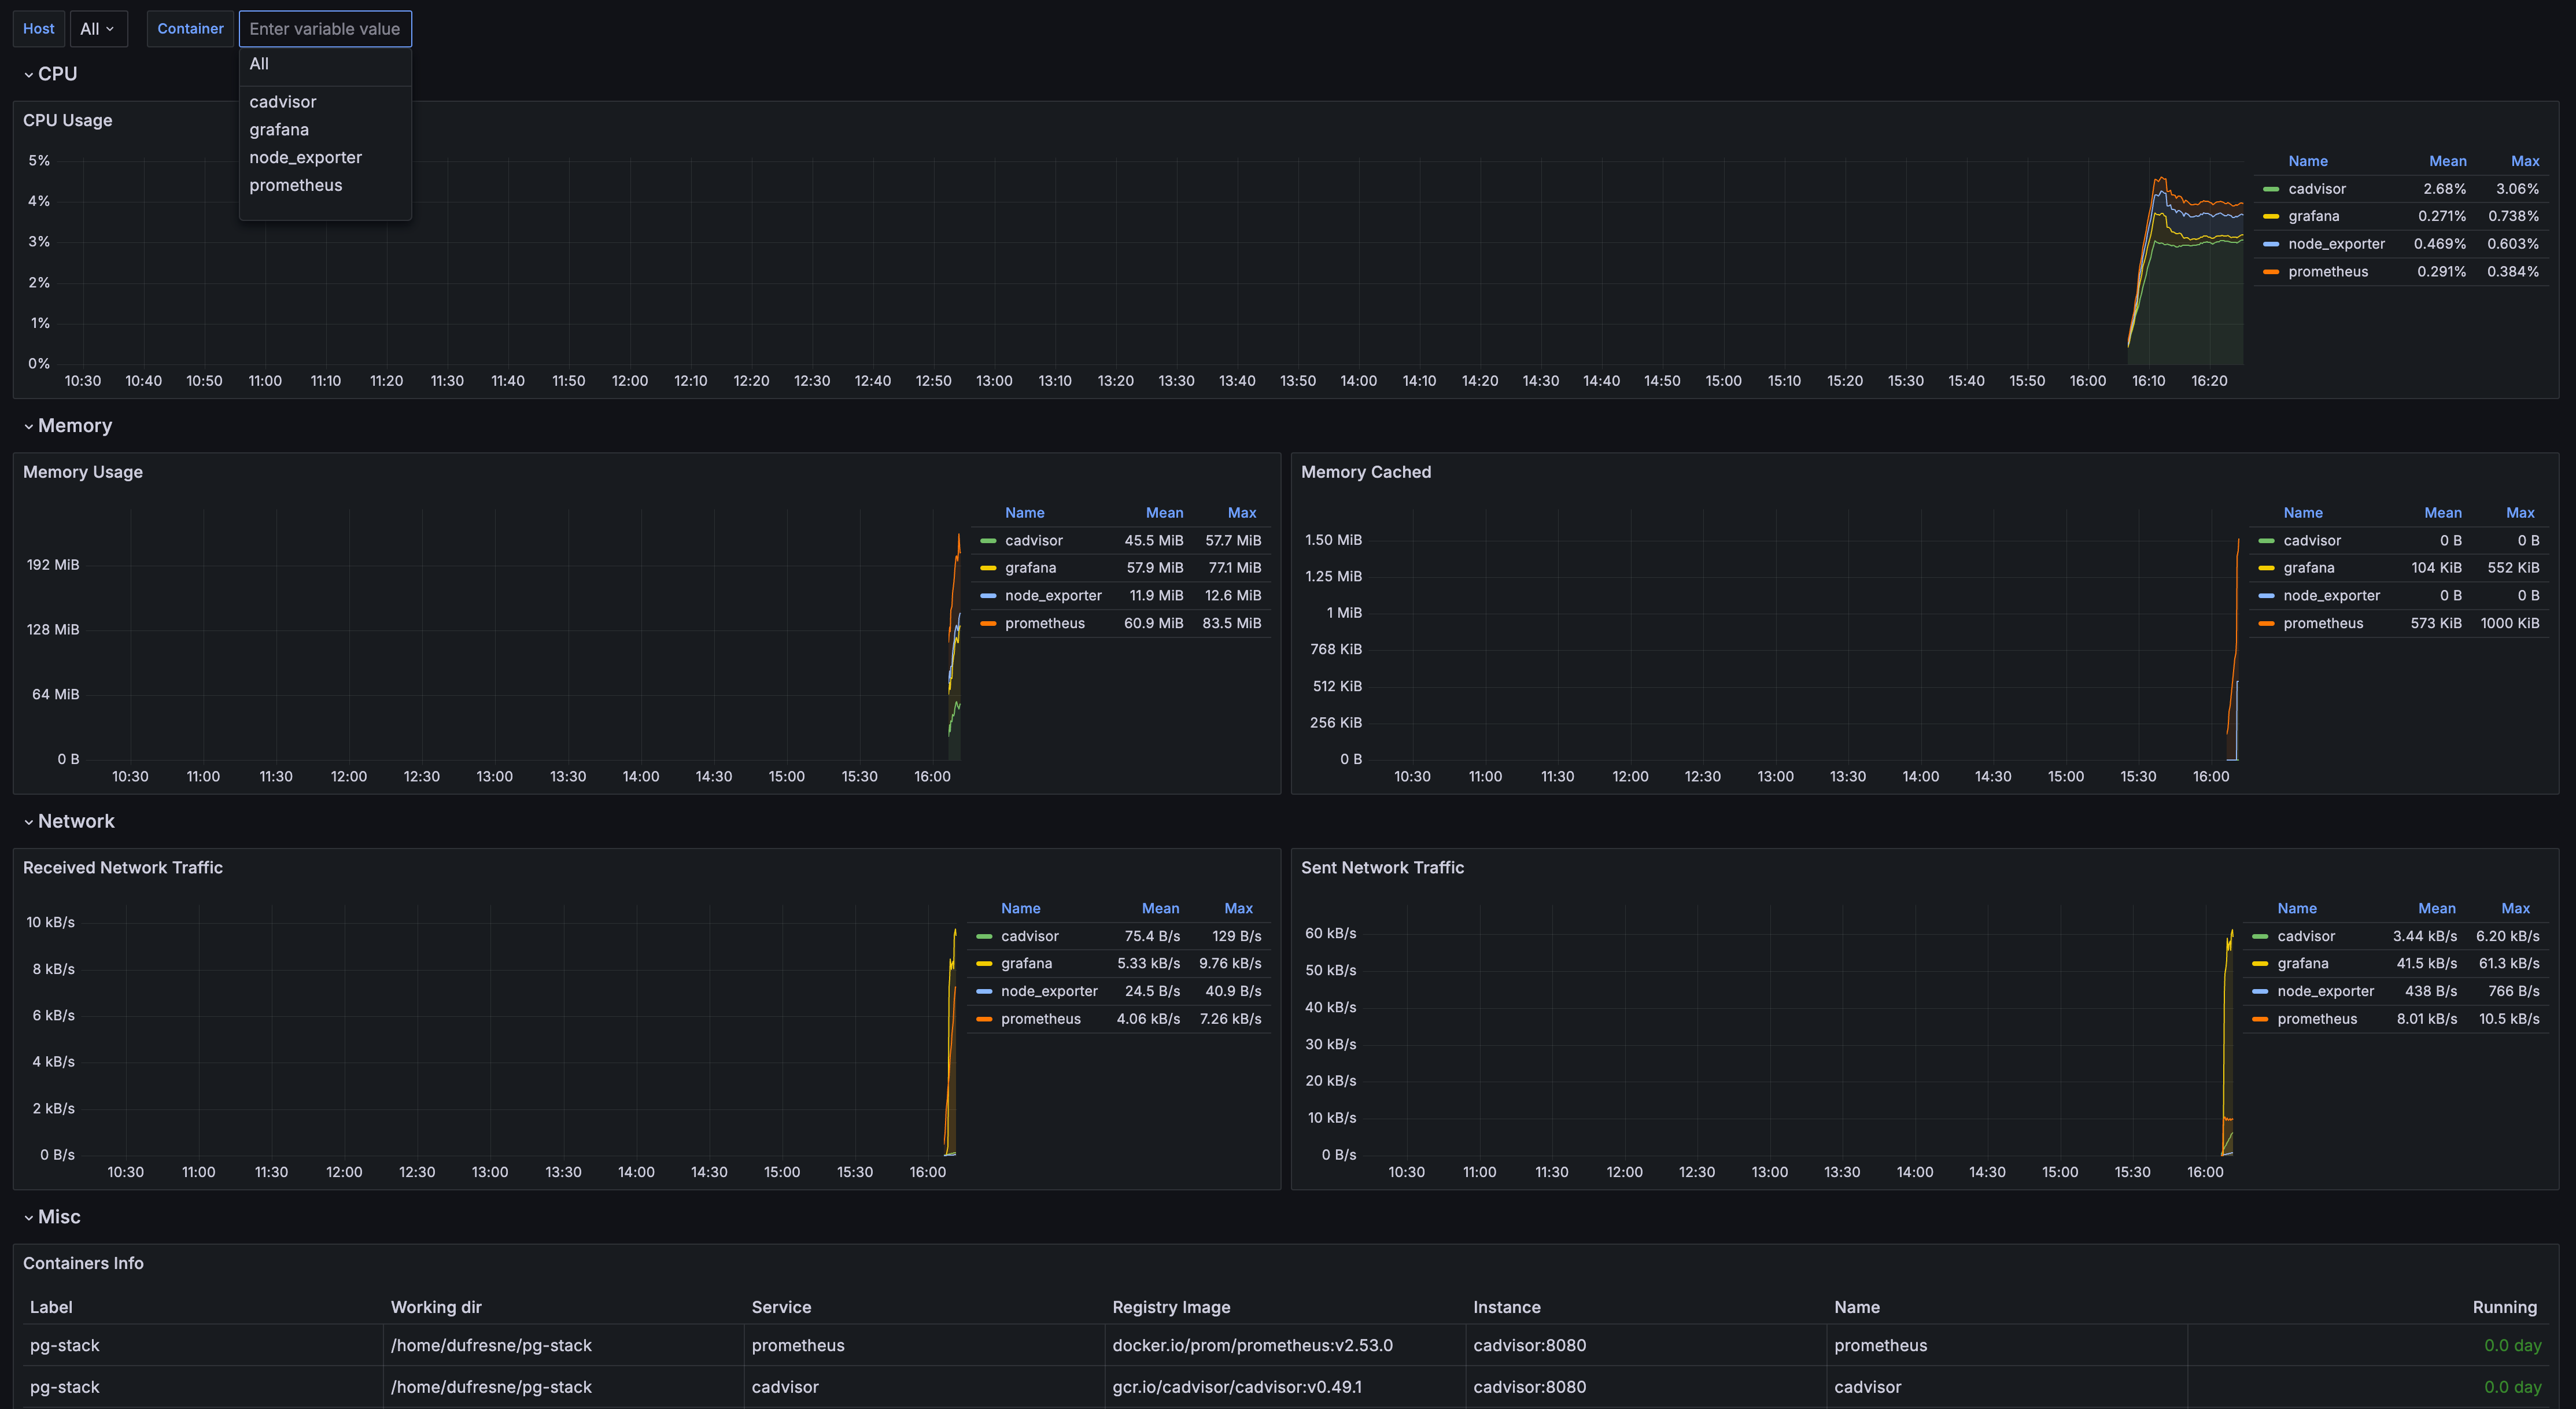
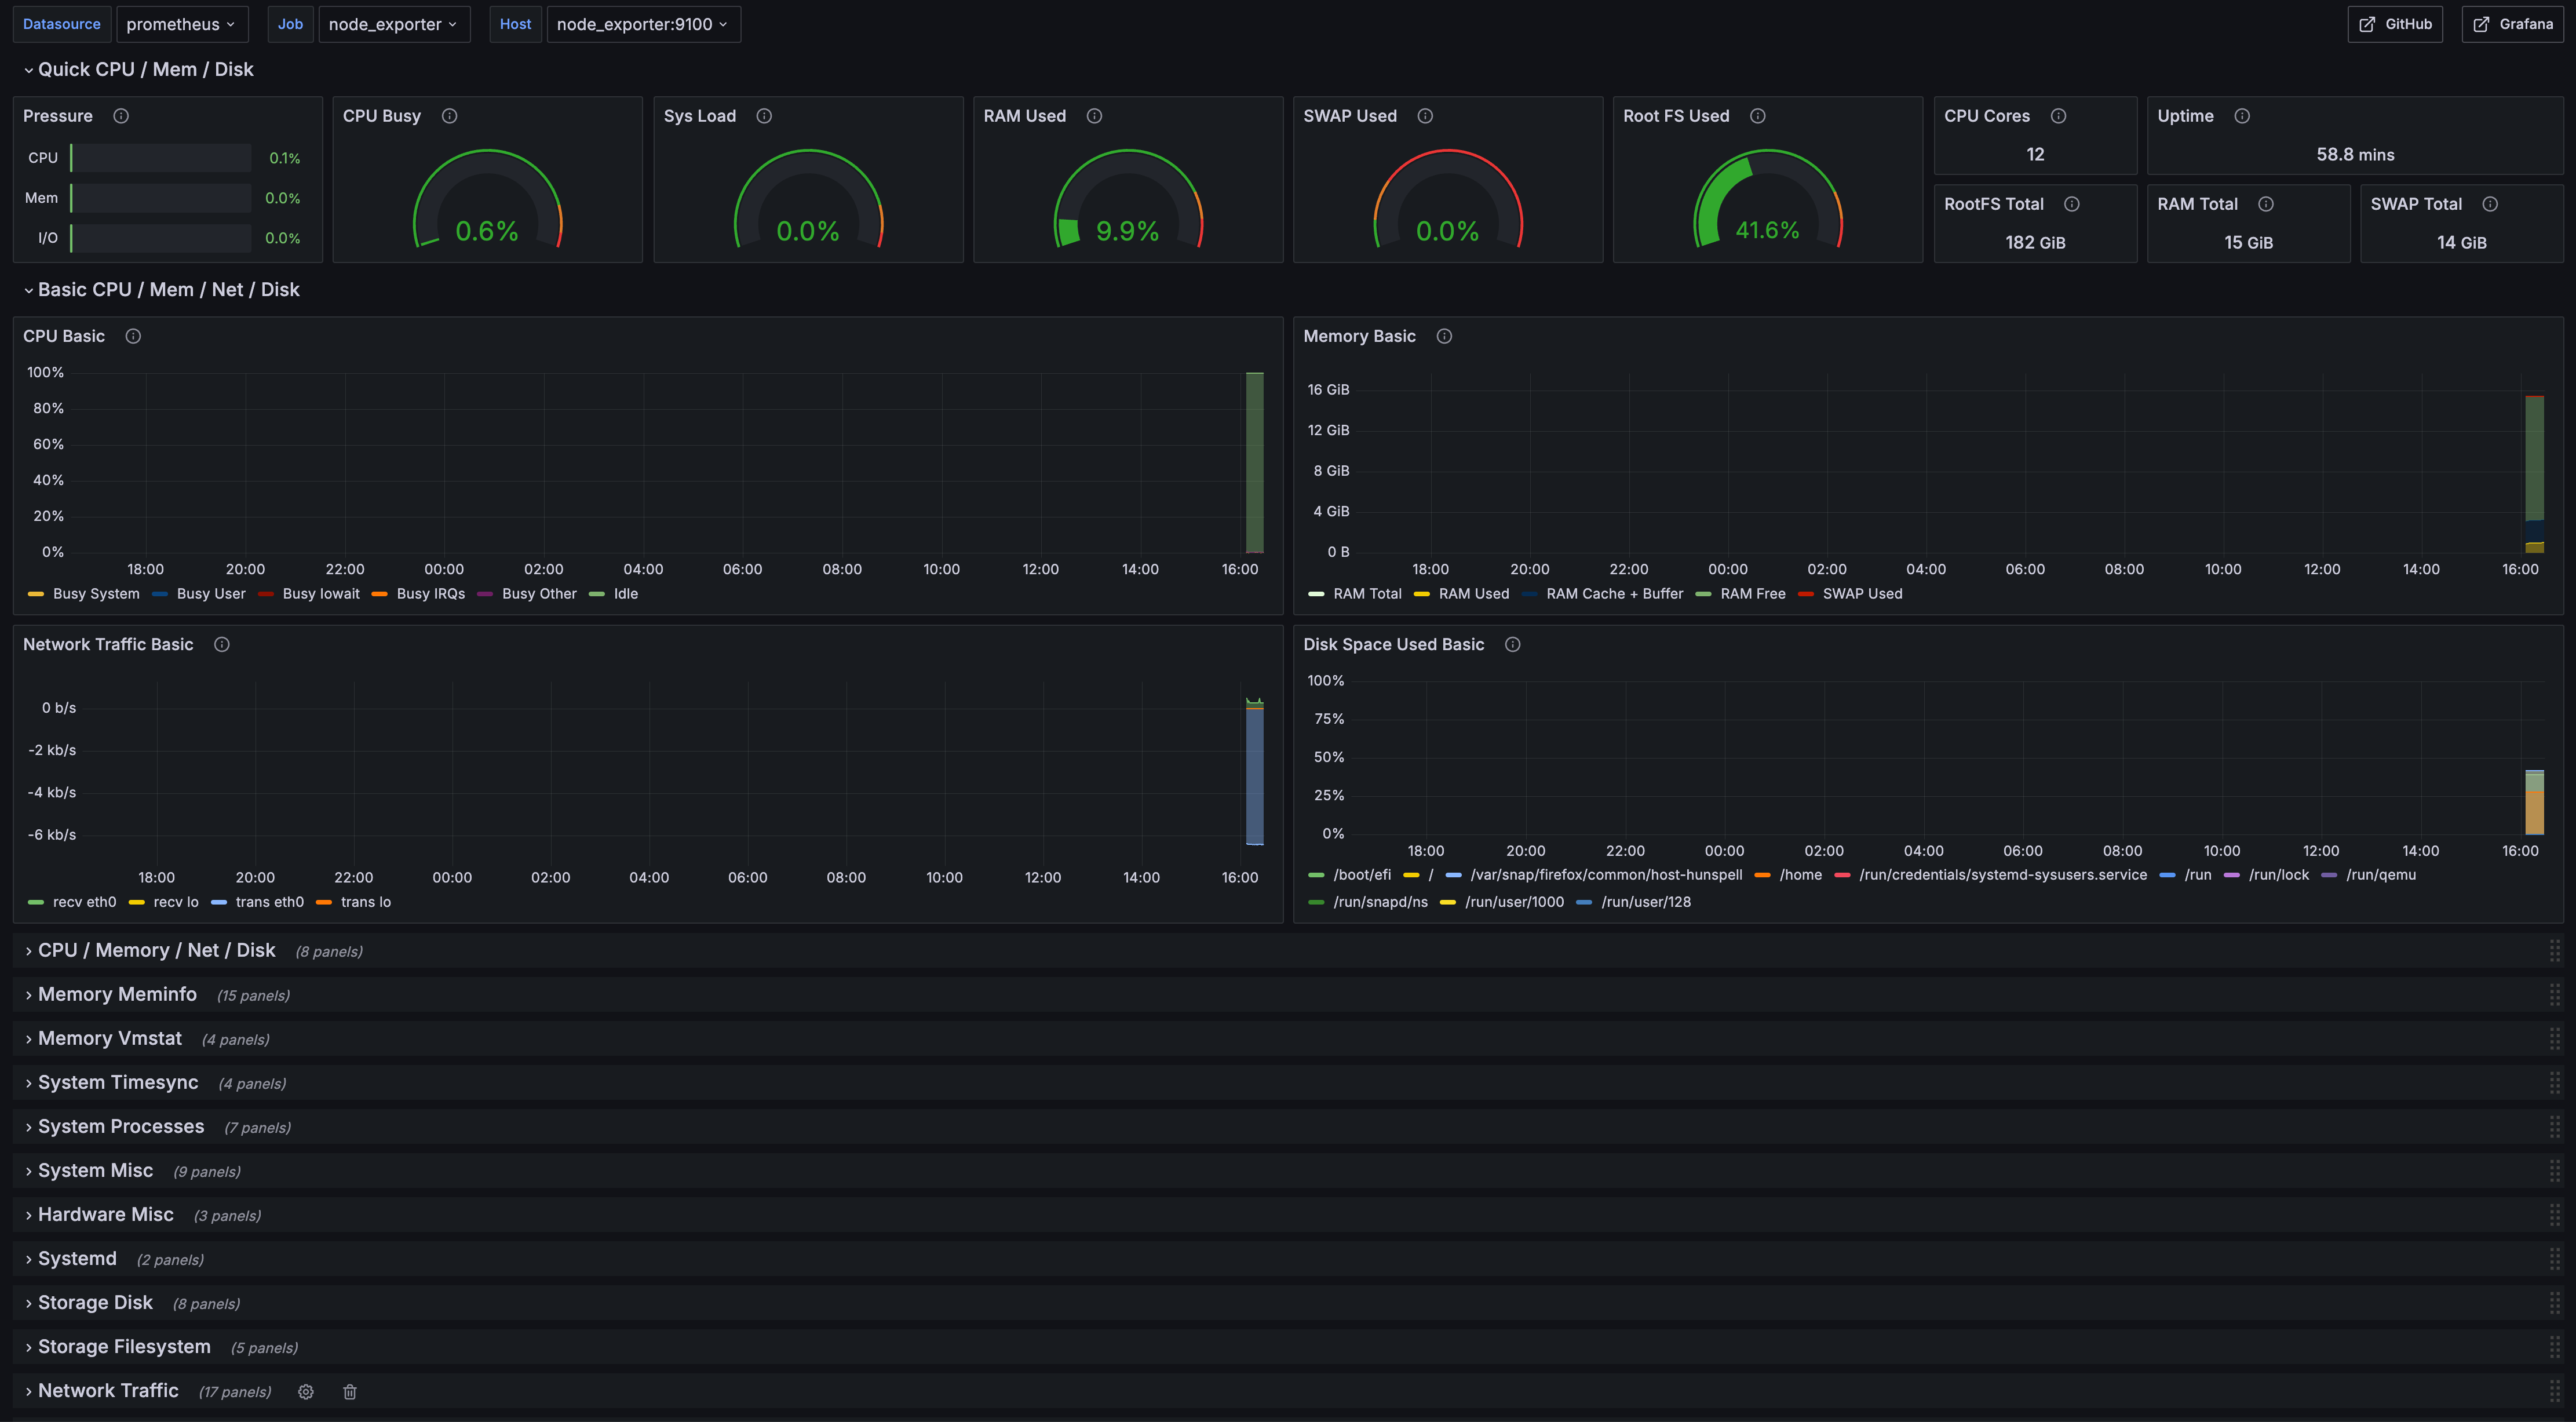
It’s been a while since I heard about Prometheus and Grafana.
It is an observability stack that can be used to monitor container resources.
Prometheus is for gathering and consolidating the resources data scraped from the containers and Grafana is for data visualization.
I decided to try it out for myself and use it for my future homelab projects!
Below is the docker-compose.yml file I used
---
volumes:
  prometheus-data:
    driver: local
  grafana-data:
    driver: local

services:
  prometheus:
    image: docker.io/prom/prometheus:v2.53.0
    container_name: prometheus
    ports:
      - 9090:9090
    command: "--config.file=/etc/prometheus/prometheus.yaml"
    volumes:
      - ./config/prometheus.yaml:/etc/prometheus/prometheus.yaml:ro
      - prometheus-data:/prometheus
    restart: unless-stopped
  grafana:
    image: docker.io/grafana/grafana-oss:11.1.0
    container_name: grafana
    ports:
      - 3000:3000
    volumes:
      - grafana-data:/var/lib/grafana
    restart: unless-stopped
  node_exporter:
    image: quay.io/prometheus/node-exporter:v1.1.0
    container_name: node_exporter
    command: "--path.rootfs=/host"
    pid: host
    restart: unless-stopped
    volumes:
      - /:/host:ro,rslave
  cadvisor:
    image: gcr.io/cadvisor/cadvisor:v0.49.1
    container_name: cadvisor
    ports:
      - 8080:8080
    volumes:
      - /:/rootfs:ro
      - /run:/run:ro
      - /sys:/sys:ro
      - /var/lib/docker:/var/lib/docker:ro
      - /dev/disk:/dev/disk:ro
    devices:
      - /dev/kmsg
    privileged: true
    restart: unless-stopped
Breakdown
The first service is for Prometheus. I used version 2.53 and created volumes for the configuration file and the main prometheus data persistency:
prometheus:
    image: docker.io/prom/prometheus:v2.53.0
    container_name: prometheus
    ports:
      - 9090:9090
    command: "--config.file=/etc/prometheus/prometheus.yaml"
    volumes:
      - ./config/prometheus.yaml:/etc/prometheus/prometheus.yaml:ro
      - prometheus-data:/prometheus
    restart: unless-stopped
Next is Grafana, our data visualizer using the data gathered by Prometheus
grafana:
    image: docker.io/grafana/grafana-oss:11.1.0
    container_name: grafana
    ports:
      - 3000:3000
    volumes:
      - grafana-data:/var/lib/grafana
    restart: unless-stopped
Then there’s Node Exporter, which Prometheus use to gather host resources metrics
node_exporter:
    image: quay.io/prometheus/node-exporter:v1.1.0
    container_name: node_exporter
    command: "--path.rootfs=/host"
    pid: host
    restart: unless-stopped
    volumes:
      - /:/host:ro,rslave
And lastly, CAdvisor, which Prometheus use to gather resource metrics of our docker containers
cadvisor:
    image: gcr.io/cadvisor/cadvisor:v0.49.1
    container_name: cadvisor
    ports:
      - 8080:8080
    volumes:
      - /:/rootfs:ro
      - /run:/run:ro
      - /sys:/sys:ro
      - /var/lib/docker:/var/lib/docker:ro
      - /dev/disk:/dev/disk:ro
    devices:
      - /dev/kmsg
    privileged: true
    restart: unless-stopped
Apparently, CAdvisor and Node Exporter needs access to the root directory, so do not deploy it on an unsecured environment.
This is quite nice!

This dashboard is from the
cadvisordata

This dashboard is from the
node-exporterdata. That’s a lot of metrics!
I can’t wait to deploy these along with my self-hosted homelab servers.